In this post I would like to talk about "ACCUMULATION Volume" and why it's such a POWERFUL tool to have in your arsenal!
"ACCUMULATION VOLUME" is also known as "Institutional Accumulation" or "Institutional Buying". Institutional investors are what's known as the "SMART MONEY". These are the the highly paid individuals who roll up their sleeves and do thorough research about the companies they're about to invest money in. Keep in mind, these people aren't investing few thousands bucks, they're investing millions and sometimes even billions in some of the companies they decide are worthy. So when they "click the buy button" their footsteps can be clearly seen via the VOLUME of shares traded on that specific day. The "Smart Money" know stuff most of us small fish don't. So when they are showing huge interest in a stock/company you better pay attention!!
These big fish investors or "whales" as Bud Fox called Gordon Gekko in the famous movie "WALL STREET", are usually the big Hedge Funds, Mutual funds, Pension Funds, Warren Buffet types etc. When these people decide to BUY a stock, the stock will MOVE and usually move in a big way and Volume will surely increase in a dramatic way as they gobble up large portions of a company's outstanding shares and that automatically drives up the stock price, while simultaneously showing a heavy increase in volume traded.
When Institutional investors BUY a stock, often times, the stock will rise and in some cases rise sharply over a sustained period of time. This phenomenon is also true on the SELL SIDE (aka 'Distribution Volume').
Today, we'll only discuss "ACCUMULATION VOLUME".
So what are we looking for?
What we want to see is a big increase (at least double or triple average daily volume) in VOLUME traded as the stock price ramps up. This is especially powerful thing when we see "accumulation volume" take place over a sustained period of time, like say over a few days, weeks or even months!
I'm gonna show you a few examples of stocks, many of them are actually from the #PowerEarningsGap watchlist since the idea behind "Power Earnings Gaps" and "institutional buying" go hand in hand pretty much !
Let's get started!

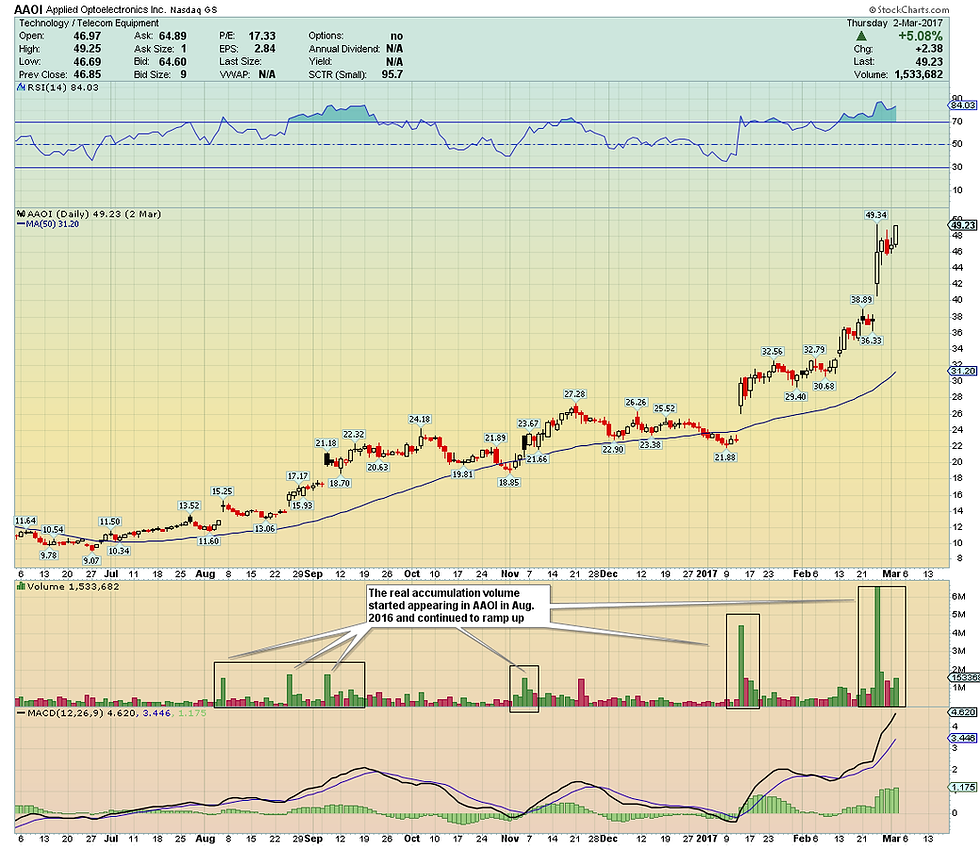
In the above chart, AAOI, a small stock that almost nobody heard of, gapped up in August 2016 on HUGE volume (Above the average volume, at least 4-5 times average daily volume) as earnings exploded higher causing it to make the "power earnings gap" watchlist. Then watch what happens over the next few weeks. VOLUME, VOLUME and more VOLUME started pouring into AAOI ! Institutional investors are starting to "circle the wagons" as they are sniffing something big coming for this company!
Notice how AAOI Volume began to increase MORE AND MORE as we move into January, February and March of 2017 as AAOI continues to make back to back big "Power Earnings Gaps". The big volume started to really pour on UP DAYS while down days' volume was very minuscule compared to the HUGE volume up days...This is classic INSTITUTIONAL ACCUMULATION VOLUME and this stock demands our attention asap and has winner written all over it ! This is why it has remained on my #PowerEarningsGap watchlist for so long.
ACCUMULATION VOLUME must take place over a sustained period of time (as you see in the above AAOI chart). And also it must not see too many high volume selling days, the red (selling) days must be on super low volume as opposed the higher than average up days.

Here's another example in AMD (above) where "ACCUMULATION VOLUME" appeared well before the stock went on a multi month rampage!

IN the above BZUN example, the chart action is way more aggressive than the previous two charts but notice how the overall VOLUME started to ramp up big time after April and May of 2017 and notice how the "ACCUMULATION VOLUME" started to ramp up big time indicating a sudden huge interest in institutional support!

This LL chart (above) is another TEXTBOOK example of what "ACCUMULATION VOLUME" looks like. See how accumulation occurred over a sustained period of time?

CHGG, in above example, you can see how "ACCUMULATION VOLUME" started to kick well before the really big stock price increase started to happen but as I said earlier, a sustained period of "ACCUMULATION VOLUME" is what we want to see, accumulation that takes place over a period of many weeks or months! That BIG "Power Earnings Gap" in May 2017 was the "game changer" for CHGG, that's what really put the stock into MOTION!

"ACCUMULATION VOLUME" doesn't only happen in small stocks like AAOI, BZUN or CHGG. It also happens in big daddy stocks like MCD

or BAC!

Look at this beauty of chart (above), RACE (Ferarri)!
"ACCUMULATION VOLUME" footprints are all over Ferrari Stock (RACE) and when you couple that with 1 or 2 "Power Earnings Gaps" you now have a KILLER Knock Out PUNCH for finding the Best Stocks in the stock market!

This MX chart (above) had signs of "ACCUMULATION VOLUME" nearly one year out. Eventually it made a 150% run from the lows!
If you're looking for more premium educational content, weekly watchlists, and an engaged private trading community, consider subscribing to Art of Trading Today!
Kommentare