A New Swing Trading Setup: $SOXL!
- Trader Stewie
- Apr 30, 2023
- 2 min read
Updated: Apr 30, 2023
Hi Folks,
I just wanted to share a new technical setup that I came across last week and analyze what stood out to me in this setup with you here today!
The market didn't make much progress in the month of April but it did allow for some consolidation and new setups to emerge. Throughout 2023 some of the strongest stocks have been those in the semiconductor sector. The volatile, choppy conditions through April lead to some actionable pullbacks to focus on. On the top of my list was the semiconductor sector.
Developments in Artificial Intelligence technologies has made many top quality semiconductor names shine once again. Pulling the Year-To-Date performance from Finviz.com "maps" section we can quickly see the top performers of the sector. Notably $NVDA, $AMD, $MPWR & $MU!

This alone is worth focusing on!
I started combing through the sector and watching multiple setups. Since the whole sector has been strong instead of individually trying to pick the best stocks I focus on ETFs. This can really help with managing volatile conditions and adding more probability into your potential trade!
First I started looking and analyzing $SMH. $SMH is a semiconductor ETF that holds a nicely weighted fund. $NVDA being the largest holding of % of Net Assets @ 14.50%.
$AMD and $MU make it within the top 10 of holdings too.

Technically speaking this is what I saw in the $SMH chart. You'll notice a strong, steady (but volatile) uptrend since mid October 2022. This trendline was tested but held early last week! Volume supported the test of this trendline!:

This was my first technical signal. Secondly you will notice a bullish wedging pattern beginning to build!
My next task at hand is looking for a potential trade with an attractive risk to reward ratio! When trading the semiconductor sector in this manner I like to consider $SOXL. $SOXL is a leveraged 3x semiconductor sector ETF. Basically if the semiconductor climbs (on average) 1% on the day $SOXL will trade up 3%. The opposite happens if it were to trade down on the day!
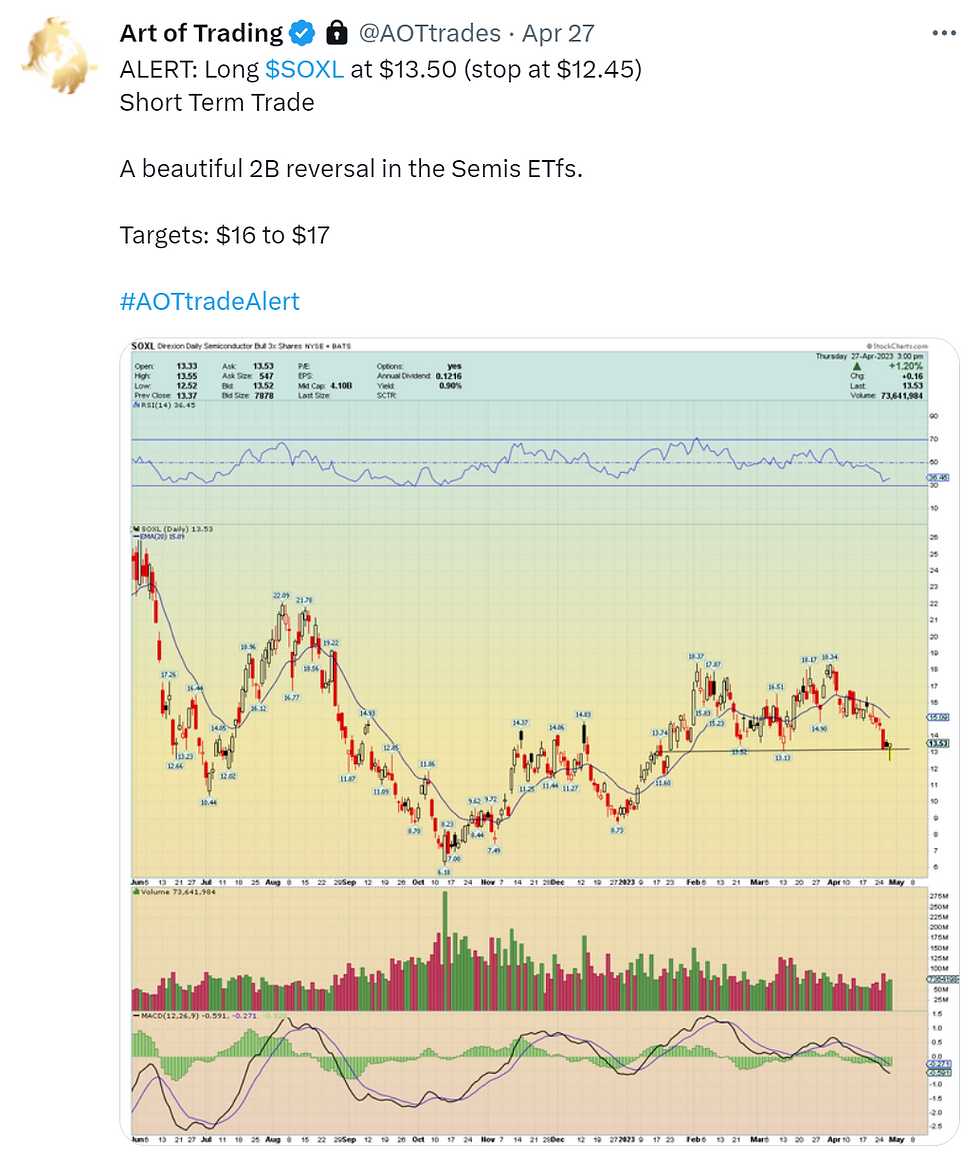
In this instance what made $SOXL an attractive technical trade was first the potential risk to reward ratio but on a more technical term the 2b Reversal the stock chart put in! Take a look at the $SOXL chart!

On April 27th $SOXL made a 2b reversal through year to day support (dotted black line on above chart)
What is a 2b reversal?
A "2b reversal" is a pattern where a previous level of support is broken and a new low is made. Shortly after that level of support is broken it is quickly reclaimed by the bulls. Bulls take control of the old level of support and begin to run the price back in a bullish manner. Sometimes these patterns can create quick V-shape recoveries back into previous points of resistance.
The pattern can look something like this:

Based on the technical characteristics of the $SOXL stock pattern and everything else I analyzed about the semiconductor sector I alerted AoT members:
Long: $SOXL @ $13.50
Stop: @ $12.45
Risk: $1.05
Potential Reward: $2.50 - $3.50

We still continue to hold this trade at the moment! Lets see how this develops in the coming week!
Cheers and happy trading!
Art of Trading

Comments